A carbon footprint represents the total amount of greenhouse gases produced directly and indirectly by human activities, measured in carbon dioxide equivalent (CO2e). This measurement encompasses all greenhouse gas emissions from energy consumption, transportation, manufacturing, and consumption patterns throughout a product’s or a person’s lifecycle.
Understanding your carbon footprint has become essential as global emissions continue rising, with 2024 marking another record year for fossil fuel emissions. Whether you’re an individual looking to reduce personal environmental impact or a business leader developing sustainability strategies, grasping carbon footprint fundamentals helps inform better decisions for our planet’s future.
TL;DR: Carbon Footprint Quick Facts
- Carbon footprint measures total greenhouse gas emissions in CO2 equivalent
- The average American emits 16 tons of CO2 annually – 4 times the global average
- Includes direct emissions (transportation, heating) and indirect emissions (manufacturing, food production)
- Major sources: energy consumption, transportation, manufacturing, agriculture
- Measured using Scope 1, 2, and 3 emission categories
- Reduction requires changes in energy use, transportation choices, and consumption patterns
- Tools exist for calculating personal and corporate carbon footprints
Understanding Carbon Footprint Fundamentals
Carbon footprint serves as a comprehensive metric for measuring environmental impact across all human activities. The concept extends beyond just carbon dioxide to include methane (CH4), nitrous oxide (N2O), and fluorinated gases (F-gases), all converted to carbon dioxide equivalent for standardized comparison. This measurement approach allows consistent evaluation of different greenhouse gas sources and their relative warming effects.
The term “carbon dioxide equivalent” accounts for each gas’s global warming potential over a specific timeframe, typically 100 years. Methane, for example, traps heat much more effectively than carbon dioxide in the short term, so one ton of methane equals approximately 25 tons of CO2e. This standardization enables accurate assessment of total climate impact regardless of which specific greenhouse gases are involved.
Carbon footprint differs significantly from ecological footprint, though both measure environmental impact. While the ecological footprint calculates the biological productive land and water area needed to support consumption patterns, the carbon footprint focuses specifically on climate change contributions through greenhouse gas emissions. Understanding this distinction helps businesses and individuals choose appropriate measurement tools for their sustainability goals.
How Carbon Footprint is Measured and Calculated
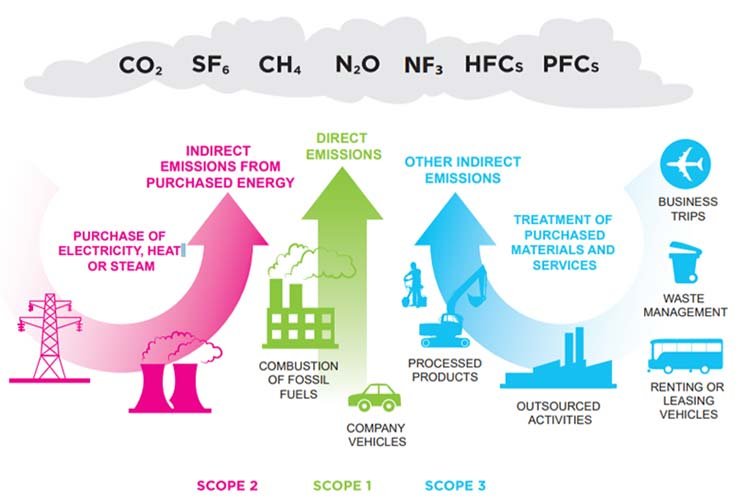
Carbon footprint calculation follows established protocols that categorize emissions into three distinct scopes, providing comprehensive coverage of all related greenhouse gas sources. This systematic approach ensures accurate measurement and prevents double-counting across different emission categories.
Scope 1, 2, and 3 Emissions
Scope 1 emissions include direct greenhouse gas releases from sources owned or controlled by an organization or individual. These encompass fuel combustion in company vehicles, facility heating systems, and industrial processes occurring on-site. For individuals, Scope 1 emissions primarily involve personal vehicle fuel consumption and home heating with natural gas or oil.
Scope 2 emissions cover indirect emissions from purchased electricity, steam, heating, and cooling consumed by the reporting entity. These emissions occur at the facility where energy is generated, but are attributable to the organization purchasing that energy. Most businesses find that Scope 2 emissions represent a significant portion of their total carbon footprint, particularly for office-based operations.
Scope 3 emissions encompass all other indirect emissions occurring in an organization’s value chain, including both upstream and downstream activities. This category includes business travel, employee commuting, purchased goods and services, waste disposal, and product use by customers. Scope 3 typically represents the largest emission category for most organizations, often accounting for 70-90% of total emissions.
Carbon Footprint Calculation Methods
Carbon footprint calculation requires collecting activity data and applying appropriate emission factors to convert activities into CO2e measurements. Activity data includes fuel consumption, electricity usage, miles traveled, and quantities of materials purchased. Emission factors, typically provided by government agencies or international standards, specify the greenhouse gas emissions per unit of activity.
The calculation process involves multiplying activity data by relevant emission factors, then aggregating results across all emission sources. For example, calculating transportation emissions requires multiplying miles driven by vehicle-specific emission factors, which vary based on fuel type, engine efficiency, and vehicle weight. Modern carbon accounting software automates these calculations while ensuring accuracy and regulatory compliance.
Advanced calculation methods account for lifecycle emissions, including upstream impacts from fuel extraction, processing, and transportation. This comprehensive approach provides more accurate carbon footprint assessments, particularly important for corporate sustainability reporting and carbon offsetting programs.
Carbon Footprint Calculator Tools
Numerous carbon footprint calculator options exist for both personal and corporate applications, ranging from simple online tools to sophisticated enterprise software platforms. Personal calculators typically assess household energy usage, transportation patterns, and consumption habits to estimate annual emissions. The EPA’s carbon footprint calculator provides reliable estimates using U.S. average emission factors and consumption patterns.
Corporate carbon footprint calculators require more detailed data collection and often integrate with existing business systems to automate data gathering. These tools typically include features for tracking emissions over time, setting reduction targets, and generating reports for sustainability disclosures. Professional carbon accounting platforms ensure compliance with international standards like the GHG Protocol and ISO 14064.
Many calculators now incorporate artificial intelligence and machine learning to improve accuracy and reduce data collection burden. These advanced tools can estimate emissions for missing data points and provide benchmarking against industry peers or geographic regions.

Personal vs Corporate Carbon Footprint
The scale and complexity of carbon footprint measurement vary dramatically between individual and organizational assessments, though both follow similar fundamental principles. Understanding these differences helps determine appropriate measurement approaches and reduction strategies for different contexts.
Personal Carbon Footprint Examples
Individual carbon footprints in developed countries typically range from 8 to 30 tons of CO2e annually, with significant variation based on income, lifestyle choices, and geographic location. The average American generates approximately 16 tons of CO2e per year, compared to the global average of 4 tons, highlighting the substantial impact of lifestyle and infrastructure differences.
Transportation represents the largest single category for most Americans, averaging 8,472 pounds of CO2 emissions annually per vehicle. Air travel contributes disproportionately to personal carbon footprints, with a single round-trip flight from New York to London generating approximately 2 tons of CO2e per passenger. This explains why frequent business travelers often have carbon footprints significantly above national averages.
Household energy consumption varies considerably by region, home size, and energy sources. Homes in northern climates typically generate higher emissions from heating, while southern regions see increased cooling-related emissions. The carbon intensity of local electricity grids dramatically affects household emissions, with coal-dependent regions producing much higher carbon footprints than areas with renewable energy sources.
Corporate Carbon Footprint Reporting
Corporate carbon footprints often exceed millions of tons of CO2e annually for large organizations, requiring sophisticated measurement and management systems. Manufacturing companies typically see the highest emissions due to energy-intensive production processes and extensive supply chain networks. Service-based businesses generally have lower absolute emissions but may still face significant Scope 3 challenges from business travel and purchased services.
Industry benchmarks help organizations assess their relative performance, with emission intensity metrics (emissions per dollar of revenue or per unit of production) providing more meaningful comparisons than absolute emission totals. Technology companies, for example, typically generate 10-50 tons of CO2e per million dollars of revenue, while heavy industry sectors may produce 100-500 tons per million dollars.
Corporate carbon footprint reporting increasingly follows standardized frameworks, including the Carbon Disclosure Project (CDP) and Task Force on Climate-related Financial Disclosures (TCFD). These frameworks require detailed emission inventories, reduction targets, and climate risk assessments, driving greater transparency and accountability in corporate sustainability efforts.
Major Sources of Carbon Emissions
Carbon emissions originate from diverse sources across the global economy, with fossil fuel combustion representing the primary driver of climate change. Understanding these sources enables targeted reduction strategies and helps prioritize efforts for maximum environmental impact.
Transportation Impact
Transportation accounts for approximately 14% of global greenhouse gas emissions, with road transport representing the largest segment within this category. Personal vehicles, freight trucking, and aviation contribute most significantly to transportation emissions, while maritime shipping and rail transport have lower emission intensities per mile traveled.
Does flying on a plane have a high carbon footprint? Yes – aviation generates some of the highest per-mile emissions of any transportation mode. A typical domestic flight produces 0.4-0.6 pounds of CO2 per passenger mile, while international flights can exceed 0.8 pounds per passenger mile due to less efficient cruise altitudes and routing. The high altitude of aircraft emissions also amplifies their climate impact compared to ground-level emissions.
Electric vehicles are rapidly reducing transportation emissions in regions with clean electricity grids, though lifecycle emissions depend heavily on battery manufacturing and electricity sources. Coal-powered electric vehicles may actually generate higher lifecycle emissions than efficient gasoline vehicles, while renewable-powered EVs can reduce emissions by 70-90% compared to conventional cars.

Energy Consumption
Energy production and consumption represent the largest global source of greenhouse gas emissions, accounting for approximately 75% of total emissions worldwide. Coal combustion generates the highest emissions per unit of energy, producing roughly twice the CO2 of natural gas and 300 times more than wind or solar power.
Residential and commercial energy consumption patterns vary significantly by climate, building efficiency, and available energy sources. Space heating and cooling typically represent 40-60% of household energy use in temperate climates, while water heating, lighting, and appliances comprise the remainder. Industrial energy consumption focuses on process heating, mechanical systems, and electrochemical processes like aluminum smelting.
The carbon intensity of electricity grids varies dramatically by region, from less than 50 grams of CO2 per kilowatt-hour in hydroelectric-powered areas to over 1,000 grams per kilowatt-hour in coal-dependent regions. This variation means that energy efficiency improvements and electrification strategies must account for local grid characteristics to assess carbon impact accurately.
Manufacturing and Industrial Processes
Industrial processes contribute approximately 21% of global emissions through both energy consumption and chemical reactions inherent to manufacturing. Steel production, cement manufacturing, and chemical processing represent the most carbon-intensive industrial activities, with limited alternatives to high-emission production methods.
Sustainable manufacturing approaches can significantly reduce industrial carbon footprints through energy efficiency, process optimization, and material substitution. Advanced manufacturing techniques, including automation and precision control systems, often improve both productivity and environmental performance by reducing waste and energy consumption per unit of output.
Many industrial processes generate emissions through chemical reactions rather than just energy consumption. Cement production, for example, releases CO2 directly from limestone decomposition, accounting for roughly 8% of global emissions. These process emissions require different reduction strategies than energy-related emissions, often involving alternative materials or carbon capture technologies.
Agriculture and Food Production
Agriculture generates approximately 24% of global greenhouse gas emissions through livestock, crop production, and land use changes. Meat products have larger carbon footprints per calorie than grain or vegetable products because of the inefficient conversion of plant to animal energy and methane released from livestock.
Beef production generates the highest emissions among common protein sources, with typical carbon footprints of 30-60 kg CO2e per kilogram of meat. This compares to 4-6 kg CO2e per kilogram for chicken and 2-4 kg CO2e per kilogram for plant-based proteins like beans or tofu. The difference stems primarily from methane emissions during digestion and the large feed requirements for cattle.
Food transportation, processing, and packaging add additional emissions to agricultural products, though these typically represent smaller contributors than production itself. Local food systems can reduce transportation emissions but may increase overall carbon footprints if local production is less efficient than optimized agricultural regions with better climate and infrastructure.
Global Carbon Footprint Statistics and Trends
Global carbon emissions continue rising despite increasing climate awareness and policy efforts, with 2024 marking another record year for fossil fuel emissions. These trends reveal both the scale of the climate challenge and the urgent need for accelerated reduction efforts across all sectors.
Record carbon emissions hit 37.4 billion tonnes from fossil fuels in 2024, representing a 0.8% increase from 2023 levels. This growth occurred despite renewable energy expansion and energy efficiency improvements, highlighting the challenge of decoupling economic growth from emission increases. Natural gas emissions drove much of this growth, increasing by 2.4% as many regions shifted from coal to gas for electricity generation.
Atmospheric CO2 concentrations reached 422.5 parts per million in 2024, representing a 52% increase above pre-industrial levels and the highest concentration in human history. This accumulation reflects the long atmospheric lifetime of CO2, requiring net-zero emissions to stabilize concentrations and limit further warming.
Regional emission trends diverge significantly, with emerging economies increasing emissions while developed countries achieve modest reductions. China’s emissions grew by an estimated 0.4% in 2024, while the United States decreased emissions by 0.5% and the European Union reduced emissions by 2.2%. These patterns reflect different stages of economic development and energy transition progress.
The top 1% of global emitters produce over 1000 times more CO2 than the bottom 1%, demonstrating massive inequality in emission responsibility. The wealthiest 10% of individuals globally account for nearly half of all energy-related emissions, while the poorest 10% contribute just 0.2% of total emissions. This inequality has important implications for climate policy and reduction strategies.
Per capita emissions vary dramatically by country, from less than 1 ton of CO2e annually in many developing countries to over 15 tons in wealthy nations. The United States, Australia, and several oil-producing nations lead global per capita emissions, while most African and South Asian countries have minimal per capita footprints despite growing populations.
Carbon Footprint Reduction Strategies
Effective carbon footprint reduction requires comprehensive strategies addressing both individual behaviors and systemic changes across energy, transportation, and economic systems. The most impactful reduction strategies typically involve switching to clean energy sources, improving efficiency, and modifying consumption patterns.

Individual Action Steps
Personal carbon footprint reduction starts with understanding which activities generate the largest emissions and targeting those areas for improvement. Transportation typically offers the highest reduction potential for most individuals, particularly through reduced flying, efficient vehicle choices, and increased use of public transportation or active mobility.
What are some ways to live a low-carbon lifestyle? Key strategies include switching to renewable electricity, improving home energy efficiency, reducing meat consumption, minimizing air travel, and choosing products with lower embedded emissions. A vegetarian diet can reduce individual food-related emissions by 30-50%, while eliminating international air travel can save 2-5 tons of CO2e annually.
Home energy improvements offer substantial reduction opportunities, particularly in older buildings with poor insulation and inefficient heating systems. Heat pumps, improved insulation, and smart energy management can reduce household emissions by 20-40% while often providing long-term cost savings through reduced energy bills.
Business Carbon Reduction Methods
Corporate carbon reduction strategies must address all three emission scopes through comprehensive sustainability programs. How can businesses reduce their supply chain carbon footprint? Effective approaches include supplier engagement programs, sustainable procurement policies, logistics optimization, and product design for reduced lifecycle emissions.
Energy efficiency improvements typically offer the fastest payback for businesses, with LED lighting, efficient HVAC systems, and process optimization often reducing operating costs while cutting emissions. Renewable energy procurement through power purchase agreements or on-site generation can eliminate Scope 2 emissions for many organizations.
Supply chain engagement requires working with suppliers to measure and reduce their emissions, often representing the largest reduction opportunity for service-based businesses. This involves setting supplier emission targets, providing technical assistance, and preferentially sourcing from low-carbon suppliers when possible.
Carbon Offset and Carbon Neutrality
Carbon offsetting allows organizations and individuals to compensate for unavoidable emissions by funding emission reduction projects elsewhere. What is the difference between carbon neutral and net zero? Carbon neutrality typically allows unlimited offsetting to balance emissions, while net-zero requires minimizing actual emissions before using offsets only for truly unavoidable residual emissions.
High-quality carbon offsets meet additionality requirements, ensuring funded projects wouldn’t have occurred without offset revenue. Forest conservation, renewable energy development, and methane capture projects represent common offset categories, though verification and permanence remain ongoing challenges for offset markets.
Carbon neutrality goals are becoming common among corporations, with many committing to net-zero targets by 2030-2050. Achieving these goals requires combining aggressive emission reductions with high-quality offsets, often involving fundamental changes to business models and operational practices.
Carbon Accounting and Environmental Standards
Standardized carbon accounting frameworks ensure consistent and comparable emission measurements across organizations and sectors. These standards provide the foundation for corporate sustainability reporting, carbon markets, and climate policy development.
The GHG Protocol serves as the global standard for carbon accounting, providing detailed guidance for measuring and reporting greenhouse gas emissions. Developed by the World Resources Institute and World Business Council for Sustainable Development, the protocol defines emission scopes, calculation methodologies, and reporting requirements used by thousands of organizations worldwide.
ISO 14064 standards complement the GHG Protocol by providing requirements for greenhouse gas emission quantification, monitoring, and verification. Part 1 covers organizational-level emission inventories, Part 2 addresses project-level emission reductions, and Part 3 specifies validation and verification requirements for emission reports.
The Intergovernmental Panel on Climate Change (IPCC) provides scientific guidance underlying most carbon accounting standards, including emission factors, global warming potential values, and methodological approaches. Regular updates to IPCC guidelines ensure carbon accounting reflects current scientific understanding of climate impacts.
Corporate carbon reporting increasingly follows mandatory disclosure requirements, with regulations like the EU Corporate Sustainability Reporting Directive and California’s climate disclosure laws requiring detailed emission inventories. The Task Force on Climate-related Financial Disclosures (TCFD) framework guides climate risk assessment and disclosure practices across financial markets.
| Aspect | Personal Carbon Footprint | Corporate Carbon Footprint |
|---|---|---|
| Typical Size | 8-30 tons CO2e annually | Thousands to millions of tons of CO2e annually |
| Main Sources | Transportation, home energy, and consumption | Manufacturing, energy, supply chain, operations |
| Measurement Scope | Direct consumption and lifestyle choices | Scope 1, 2, and 3 emissions across the value chain |
| Calculation Tools | Online calculators, utility bills | Professional software, consultants, and auditing |
| Reduction Strategies | Behavior change, efficiency, and clean energy | Process improvement, renewable energy, supply chain engagement |
| Reporting Requirements | Voluntary personal tracking | Mandatory disclosure in many jurisdictions |
| Verification Needs | Self-assessment typically sufficient | Third-party verification is often required |
| Timeline for Action | Immediate behavior changes are possible | Multi-year transformation programs are typical |
Conclusion
Understanding what carbon footprint means provides the foundation for meaningful climate action at both individual and organizational levels. As global emissions continue reaching record highs, measuring and reducing carbon footprints becomes increasingly critical for limiting climate change impacts. The average American’s 16-ton annual carbon footprint demonstrates significant room for improvement compared to the global average and climate targets.
Effective carbon footprint reduction requires addressing the largest emission sources first: energy consumption, transportation choices, and consumption patterns. Whether calculating personal emissions or managing corporate sustainability programs, success depends on accurate measurement, targeted reduction strategies, and ongoing monitoring of progress toward climate goals.
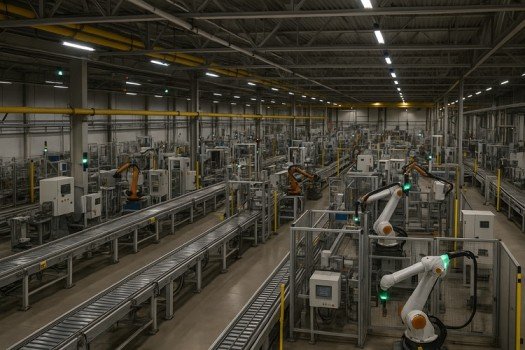
Companies like Plentiful Choices are leading the way by integrating sustainability considerations into their industrial services, international trading, and digital production capabilities. Their commitment to smart solutions for a better future reflects the growing recognition that environmental stewardship and business success must advance together in addressing our climate challenges.
Frequently Asked Questions
A carbon footprint measures greenhouse gas emissions from activities, expressed in CO2 equivalent. An ecological footprint measures the biological productive land and water area needed to support consumption patterns. Carbon footprint focuses specifically on climate impact, while ecological footprint addresses broader resource consumption.
Use online carbon calculators that assess your energy usage, transportation patterns, and consumption habits. The EPA carbon footprint calculator provides reliable estimates using utility bills, vehicle information, and lifestyle data.
Start with high-impact changes: switch to renewable electricity, improve home energy efficiency, reduce air travel, choose efficient transportation, and eat less meat. These actions typically offer the largest emission reductions with reasonable effort.
Yes, vegetarian diets typically reduce food-related emissions by 30-50% compared to omnivorous diets. Beef has particularly high emissions (30+ kg CO2e per kg), while plant-based proteins generate 2-4 kg CO2e per kg.
Yes, recycling significantly reduces emissions compared to producing new materials. Recycling aluminum saves 95% of the energy needed for new production, while recycling paper reduces emissions by 60% compared to virgin materials.
Companies achieve carbon neutrality by measuring their complete carbon footprint, implementing reduction strategies across operations and supply chains, and purchasing high-quality carbon offsets for remaining emissions. Success requires setting science-based targets and engaging suppliers.
The internet accounts for approximately 4% of global greenhouse gas emissions, similar to the aviation industry. Data centers, network infrastructure, and device manufacturing contribute most emissions, with streaming video and cloud services being major drivers of digital carbon footprints.